DAVID Documentation: Gene Functional Classification
Grouping genes based on functional similarity can systematically enhance biological interpretation of large lists of genes derived from high throughput studies. The Functional Classification Tool generates a gene-gene similarity matrix, using a Kappa statistic, based on shared functional annotation using thousands of terms from multiple categories. This matrix is then used by a novel fuzzy clustering algorithm to group functionally related genes.
-
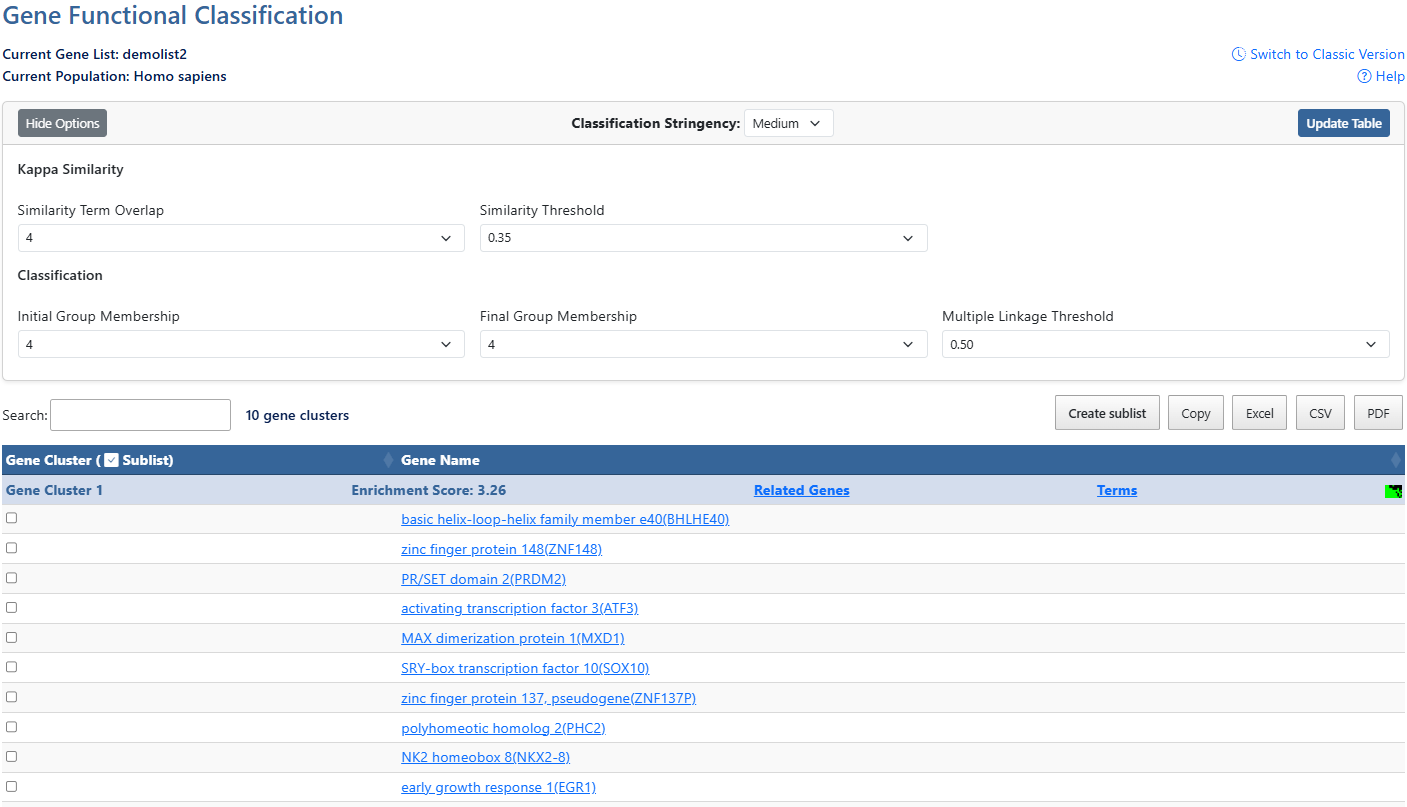
Gene ListCurrent gene list selected for view and background species being analyzed.
-
Help and Switch to Classic VersionLink to this help page and provides access to the legacy Gene List Report interface.
-
Show/Hide OptionsClick this button to expand or hide additional filtering options.
-
Classification StringencyClick to access a drop-down menu of stringency levels, then click desired level to select. A high-level single control to establish a set of detailed parameters involved in functional classification algorithms. In general, the higher stringency setting generates less functional groups with more tightly associated genes in each group, so that more genes will be unclustered.
-
Update TableAfter making adjustments to filtering options, click this button to update the table using the selected parameters.
-
Similarity Term OverlapClick to access a drop-down menu of overlap values. The minimum number of annotation terms overlapped between two genes in order to be qualified for kappa calculation. This parameter is to maintain necessary statistical power to make the kappa value more meaningful. The higher the value, the more meaningful the result is.
-
Similarity ThresholdClick to access a drop-down menu of theshrold values. The minimum kappa value to be considered significant. A higher setting will lead to more genes going unclustered, which leads to a higher quality functional classification result with fewer groups and fewer gene members. Kappa value of 0.3 starts giving meaningful biology based on our genome-wide distribution study. Anything below 0.3 has a good chance to be noise.
-
Initial Group MembershipClick to access a drop-down menu of membership values. The minimum gene number in a seeding group, which affects the minimum size of each functional group in the final cluster. In general, the lower value attempts to include more genes in functional groups, and may generate a lot of small size groups.
-
Final Group MembershipClick to access a drop-down menu of membership values. The minimum gene number in one final group after a 'cleanup' procedure. In general, the lower value attempts to include more genes in functional groups and may generate a lot of small size groups. It cofunctions with previous parameters to control the minimum size of functional groups. If you are interested in functional groups containing only 2 or 3 genes, you need to set it to a very low value. Otherwise, the small group will not be displayed and the genes will go unclustered.
-
Multiple Linkage ThresholdClick to access a drop-down menu of threshold values. This parameter controls how seeding groups merge with each other, i.e. two groups sharing the same gene members over the percentage will become one group. A higher percentage, in general, gives sharper separation (i.e. it generates more final functional groups with more tightly associated genes in each group). In addition, changing the parameter does not cause additional genes to go unclustered.
-
Search & Cluster countThe search box filters all table results in real time and shows how many clusters are present in results.
-
Create sublist, Export options & Column VisibilityCreate a sublist by clicking on checkboxes to the left of desired results, then clicking the Create sublist button, where you will be prompted to name the new sublist. Sublists will then appear in the list manager as a new gene list.
Results can be exported using Copy, Excel, CSV, or PDF. Exports reflect the current filtered and sorted view.
Additional columns can be added to the current view using the Column Visibility drop-down button. Click on available items to add the column to the table. -
Sortable ColumnsClick on any table column header to sort the table by that column in ascending or descending order.ClusterA group of genes having similar biological meaning due to sharing similar terms.Enrichment ScoreThe overall enrichment score for the group based on the EASE scores of each gene. Higher value = more enriched.Related Genes (RG)Click the RG link to explore functionally related genes associated with each entry. For more information, see the Related Genes documentation page.TermsClick the Terms link to explore the Cluster Term Report for each gene. For more information, see the Cluster Term Report documentation page.Cluster viewClick this icon to be directed to a 2D cluster view of the genes in this cluster.SublistClick on check boxes to select items for creating a sublist. (12)Gene NameClick the gene name link to explore the full gene report. For more information, see the Gene Report documentation page.