DAVID Documentation: Functional Annotation Chart
Chart Report is an annotation term focused view which lists annotation terms and their associated genes under study. To avoid over counting duplicated genes, the Fisher Exact statistics is calculated based on corresponding DAVID gene IDs by which all redundancies in original IDs are removed.
-
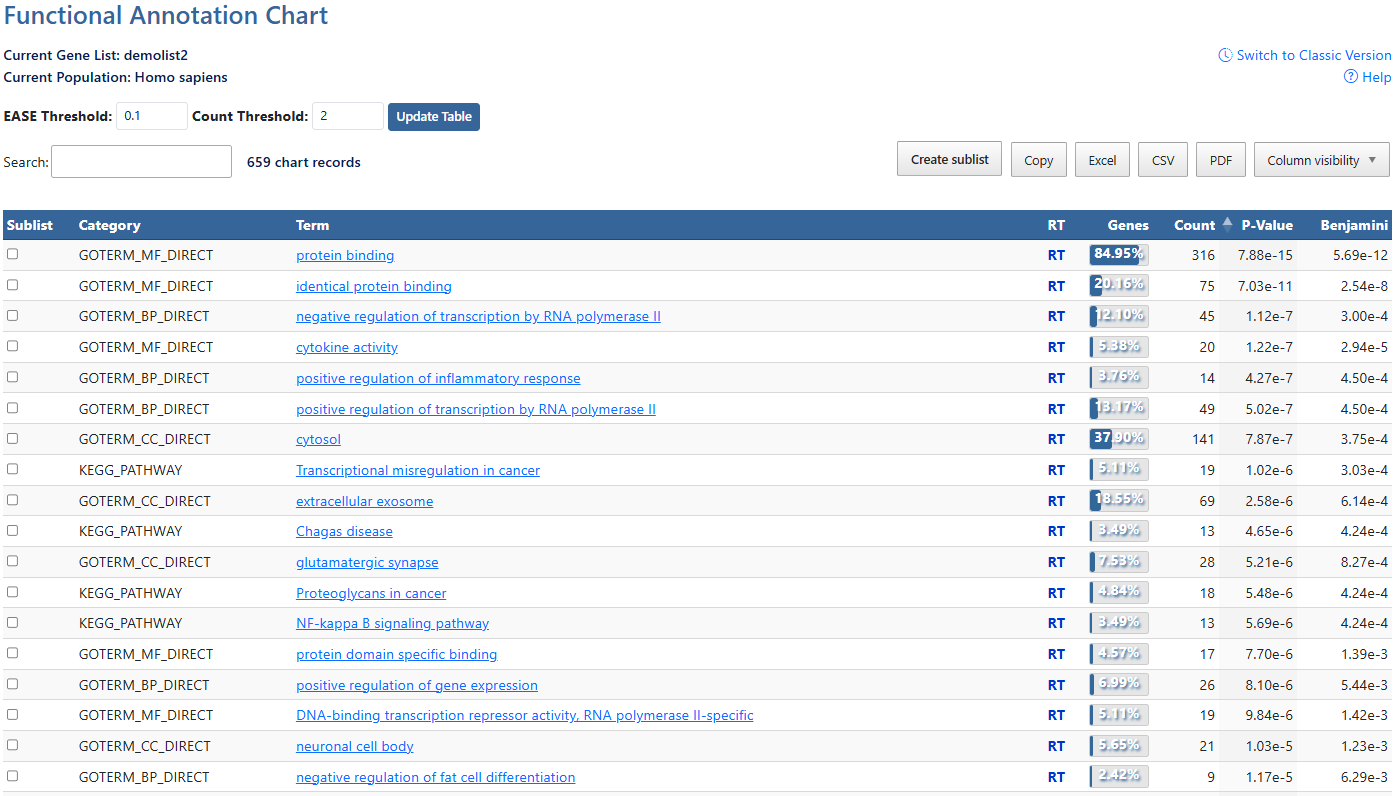
Current Gene List & PopulationDisplays the active gene list and selected species or background population.
-
Help and Switch to Classic VersionLink to this help page and provides access to the legacy Gene List Report interface.
-
EASE ThresholdMinimum P-value of results to be displayed. Click to either type a numberical value or use the up/down arrows to increment by 0.01.
-
Count ThresholdMinimum gene count of annotation result to be displayed. Click to either type a numberical value or use the up/down arrows to increment by 1.
-
Update TableAfter making adjustments to filtering options, click this button to update the table using the selected parameters.
-
Search and Record CountThe search box filters table results in real time. The record count indicates total entries and the number of DAVID genes mapped.
-
Create sublist, Export options & Column VisibilityCreate a sublist by clicking on checkboxes to the left of desired results, then clicking the Create sublist button, where you will be prompted to name the new sublist. Sublists will then appear in the list manager as a new gene list.
Results can be exported using Copy, Excel, CSV, or PDF. Exports reflect the current filtered and sorted view.
Additional columns can be added to the current view using the Column Visibility drop-down button. Click on available items to add the column to the table. -
Sortable ColumnsClick on any table column header to sort the table by that column in ascending or descending order.SublistClick on check boxes to select items for creating a sublist. (7)CategoriesCategories of term results, indicating orginal source of information. (e.g. UP = uniprot). Click to sort by this value.AnnotationsAnnotations available for each item. If available, hyperlinks lead users to original resources for further details. Click to sort by this value.Related TermsClick RT to be directed to a Functionally Related Terms search result for each term. For more information, see the Related Terms documentation page.Gene Count and PercentageCount and percentage of genes involved in each term.P-value & BenjaminiEASE Score where smaller means more enriched. Benjamini in DAVID requests adjusted p-values by using the linear step-up method of Benjamini and Hochberg