DAVID Documentation: Functional Annotation Clustering
Functional Annotation Clustering groups similar annotations together using a novel fuzzy clustering algorithm. The algorithm is based on the hypothesis that similar annotations should have similar gene members. The Functional Annotation Clustering integrates the same techniques of Kappa statistics to measure the degree of the common genes between two annotations.
-
Gene ListCurrent gene list selected for view and background species being analyzed.
-
Help and Switch to Classic VersionLink to this help page and provides access to the legacy Gene List Report interface.
-
Show/Hide OptionsClick this button to expand or hide additional filtering options.
-
Classification StringencyClick to access a drop-down menu of stringency levels, then click desired level to select. A high-level single control to establish a set of detailed parameters involved in functional classification algorithms. In general, the higher stringency setting generates less functional groups with more tightly associated genes in each group, so that more genes will be unclustered.
-
EASE ThresholdMinimum P-value of results to be displayed. Click to either type a numberical value or use the up/down arrows to increment by 0.01.
-
Update TableAfter making adjustments to filtering options, click this button to update the table using the selected parameters.
-
Similarity Term OverlapClick to access a drop-down menu of overlap values. The minimum number of annotation terms overlapped between two genes in order to be qualified for kappa calculation. This parameter is to maintain necessary statistical power to make the kappa value more meaningful. The higher the value, the more meaningful the result is.
-
Similarity ThresholdClick to access a drop-down menu of theshrold values. The minimum kappa value to be considered significant. A higher setting will lead to more genes going unclustered, which leads to a higher quality functional classification result with fewer groups and fewer gene members. Kappa value of 0.3 starts giving meaningful biology based on our genome-wide distribution study. Anything below 0.3 has a good chance to be noise.
-
Initial Group MembershipClick to access a drop-down menu of membership values. The minimum gene number in a seeding group, which affects the minimum size of each functional group in the final cluster. In general, the lower value attempts to include more genes in functional groups, and may generate a lot of small size groups.
-
Final Group MembershipClick to access a drop-down menu of membership values. The minimum gene number in one final group after a 'cleanup' procedure. In general, the lower value attempts to include more genes in functional groups and may generate a lot of small size groups. It cofunctions with previous parameters to control the minimum size of functional groups. If you are interested in functional groups containing only 2 or 3 genes, you need to set it to a very low value. Otherwise, the small group will not be displayed and the genes will go unclustered.
-
Multiple Linkage ThresholdClick to access a drop-down menu of threshold values. This parameter controls how seeding groups merge with each other, i.e. two groups sharing the same gene members over the percentage will become one group. A higher percentage, in general, gives sharper separation (i.e. it generates more final functional groups with more tightly associated genes in each group). In addition, changing the parameter does not cause additional genes to go unclustered.
-
SearchThe search box filters all table results in real time.
-
Create sublist, Export options & Column VisibilityCreate a sublist by clicking on checkboxes to the left of desired results, then clicking the Create sublist button, where you will be prompted to name the new sublist. Sublists will then appear in the list manager as a new gene list.
Results can be exported using Copy, Excel, CSV, or PDF. Exports reflect the current filtered and sorted view.
Additional columns can be added to the current view using the Column Visibility drop-down button. Click on available items to add the column to the table. -
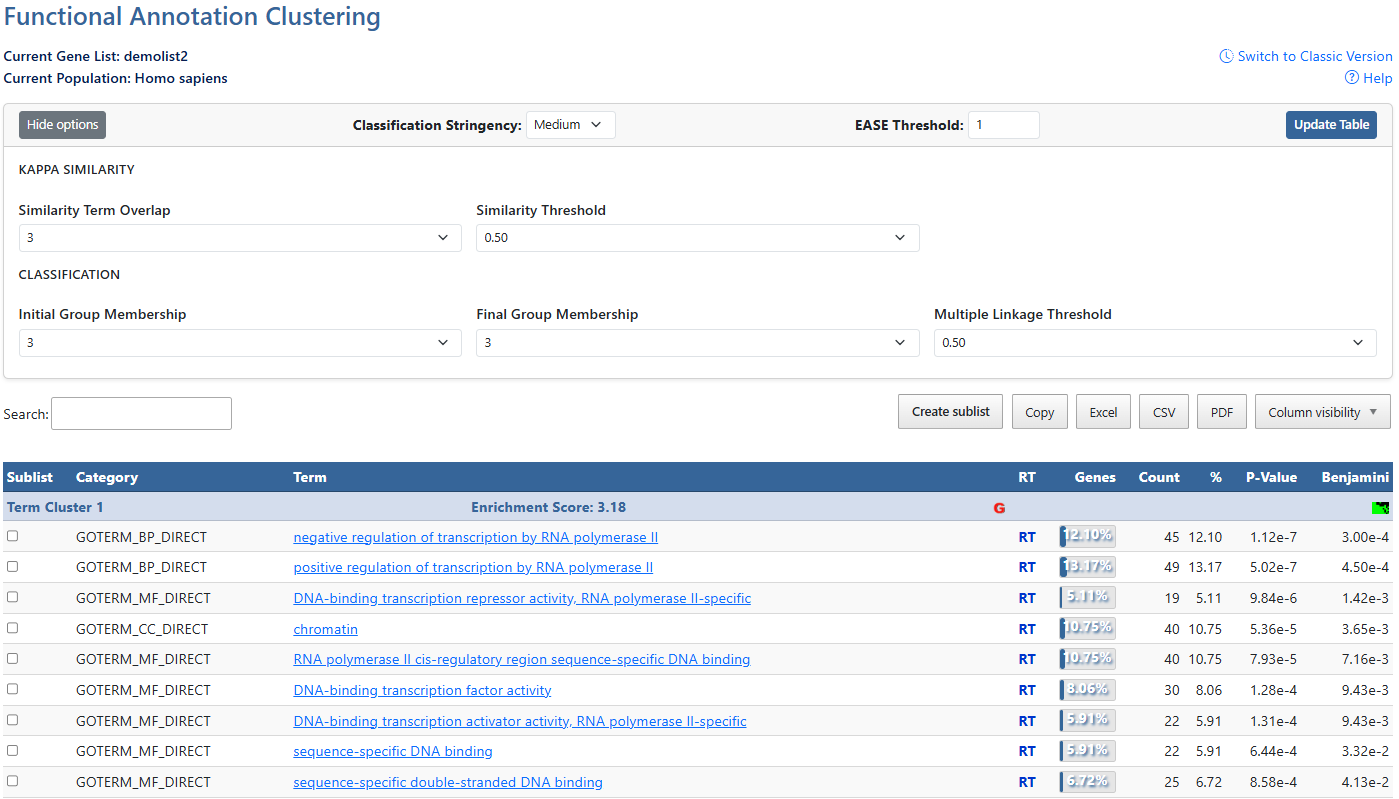
Sortable ColumnsClick on any table column header to sort the table by that column in ascending or descending order.ClusterA group of terms having similar biological meaning due to sharing similar gene members.Enrichment ScoreThe overall enrichment score for the group based on the EASE scores of each term member. Higher value = more enriched.Gene ReportClick on the red G to be directed to the Gene Report page for that genes in this cluster.Cluster viewClick this icon to be directed to a 2D cluster view of the genes in this cluster.AnnotationsAnnotations available for each item. If available, hyperlinks lead users to original resources for further detials.Related TermsClick RT to be directed to a Functionally Related Terms search result for each term. For more information, see the Related Terms documentation page.Gene Count and PercentageCount and percentage of genes involved in each term.P-value & BenjaminiEASE Score where smaller means more enriched. Benjamini in DAVID requests adjusted p-values by using the linear step-up method of Benjamini and Hochberg