DAVID Documentation: Annotation Summary
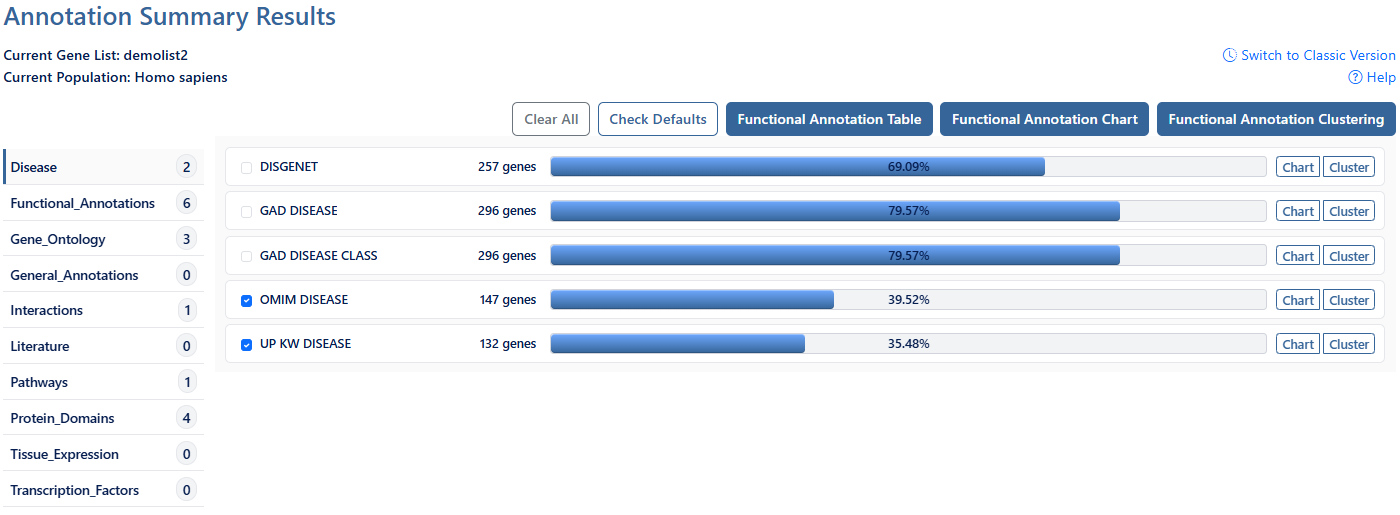
The Annotation Summary presents annotation associated with the user's gene list within a compact, category-driven layout with interactive selection controls that allows navigation to Functional Annotation Table, Chart, or Clustering results for single or multiple annotation categories.
-
Current Gene List & PopulationDisplays the active gene list and selected species or background population.
-
Help and Switch to Classic VersionLink to this help page and provides access to the legacy Gene List Report interface.
-
CategoriesClick each category to expand and view additional annotation categories. Check/uncheck the items to add/remove them from your selection.
-
Clear AllClick this button to clear all selections.
-
Check DefaultClick this button to undo any currect selections and revert to default selections.
-
Functional Annotation TableClick this button to view the Functional Annotation Table for all selections. This is a gene-centric view which lists the genes and their associated annotation terms. For more information, see the Functional Annotation Table documentation page.
-
Functional Annotation ChartClick this button to view the Functional Annotation Chart for all selections. Chart Report is an annotation term focused view which lists annotation terms and their associated genes under study. For more information, see the Functional Annotation Chart documentation page.
-
Functional Annotation ClusteringClick this buttn to view the Functional Annotation Clustering for all selections. Functional Annotation Clustering integrates Kappa statistics to measure the degree of the common genes between two annotations. For more information, see the Functional Annotation Clustering documentation page.
-
Gene countNumber of genes from the user list involved in this annotation category.
-
Gene Percentage & Single TablePercentage of genes from user list involved in this category out of total genes from user list.
Click this percentage bar to be directed to a functional annotation table for user genes in this annotation category ONLY. -
Single ChartClick this button to be directed to a functional annotation chart for user genes in this annotation category ONLY.
-
Single ClusterClick this button to be directed to a functional annotation cluster for user genes in this annotation category ONLY.